
What is Analyze mode
Analyze mode helps in tracking the transaction traffic within each workflows on a version level. It gives the user an aggregate view of the communication flow at every node which helps the user to explore and analyse the flow at different touch points.
Problems we were trying to solve
- Inability to view the flow performance in real-time/near real-time
- Visibility into no. of customers who have responded to an outbound message
- Reducing the time taken to get the aggregate counts at various customer touch-points
- Difficulty in identifying the errors at every node in the flow
- Inability to diagnose the flow easily and make necessary changes in the flow as per the trend and customer response pattern
My role
- User research
- Wire-framing
- Prototyping
- UI design and Interactions
- Collaborating with PMs and developers
UI screens
The screens which we have come up with for Analyze mode are given below. Please read further to understand the interactions and the user journey.
Problem statement - 1
Once the flow is built and made live, I am not able to know at which node how many transactions are running successfully and at which node there are drop-outs caused by errors or failure. I don’t have a view on how the flow is performing, how well are we reaching our customers and how is our customer responding to us in my communication flow.
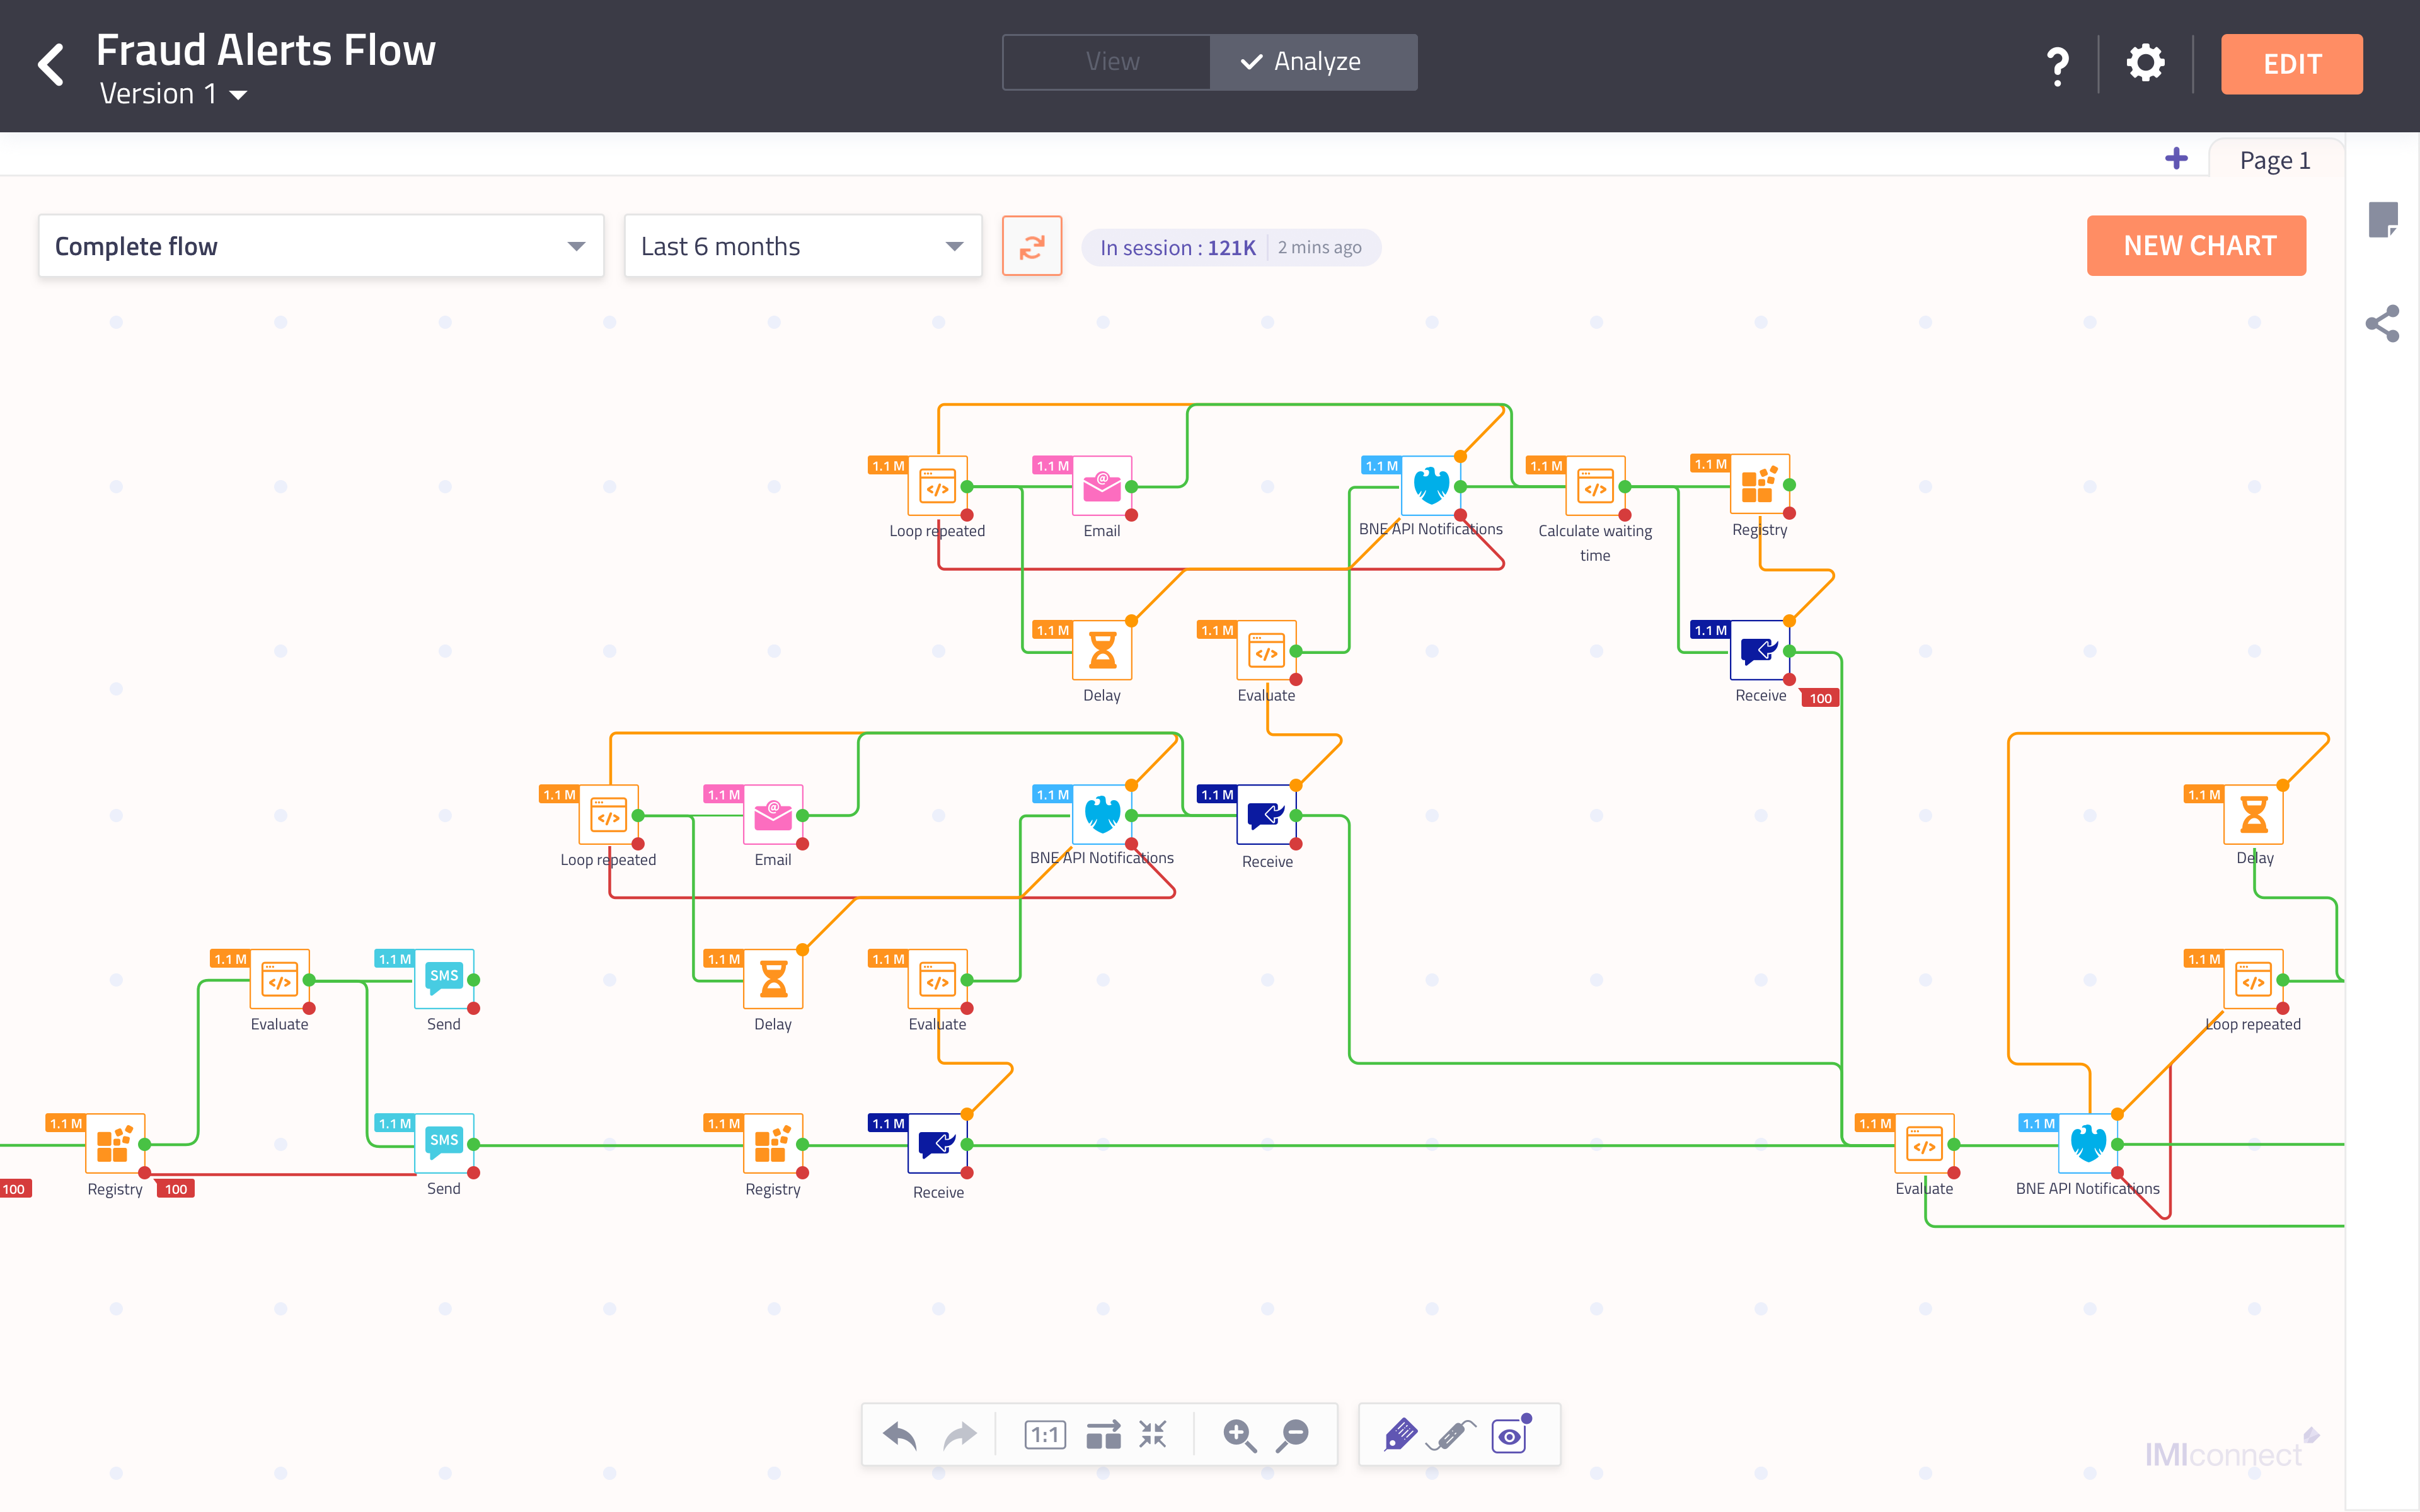
Solution
When a flow is built and made live, providing a view to the user with the transaction information as counters at each node for every node outcome on the connector linked to the node will be an upfront insight view. This view as an analytics mode on the flow canvas will solve the problem for the user of not being able to know the flow performance and if required can modify the flow as per the customer pattern identified in the analysis.
Problem statement - 2
Once the flow is live, I don’t have the ability to analyse different segments in the flow which I consider as business outcomes.
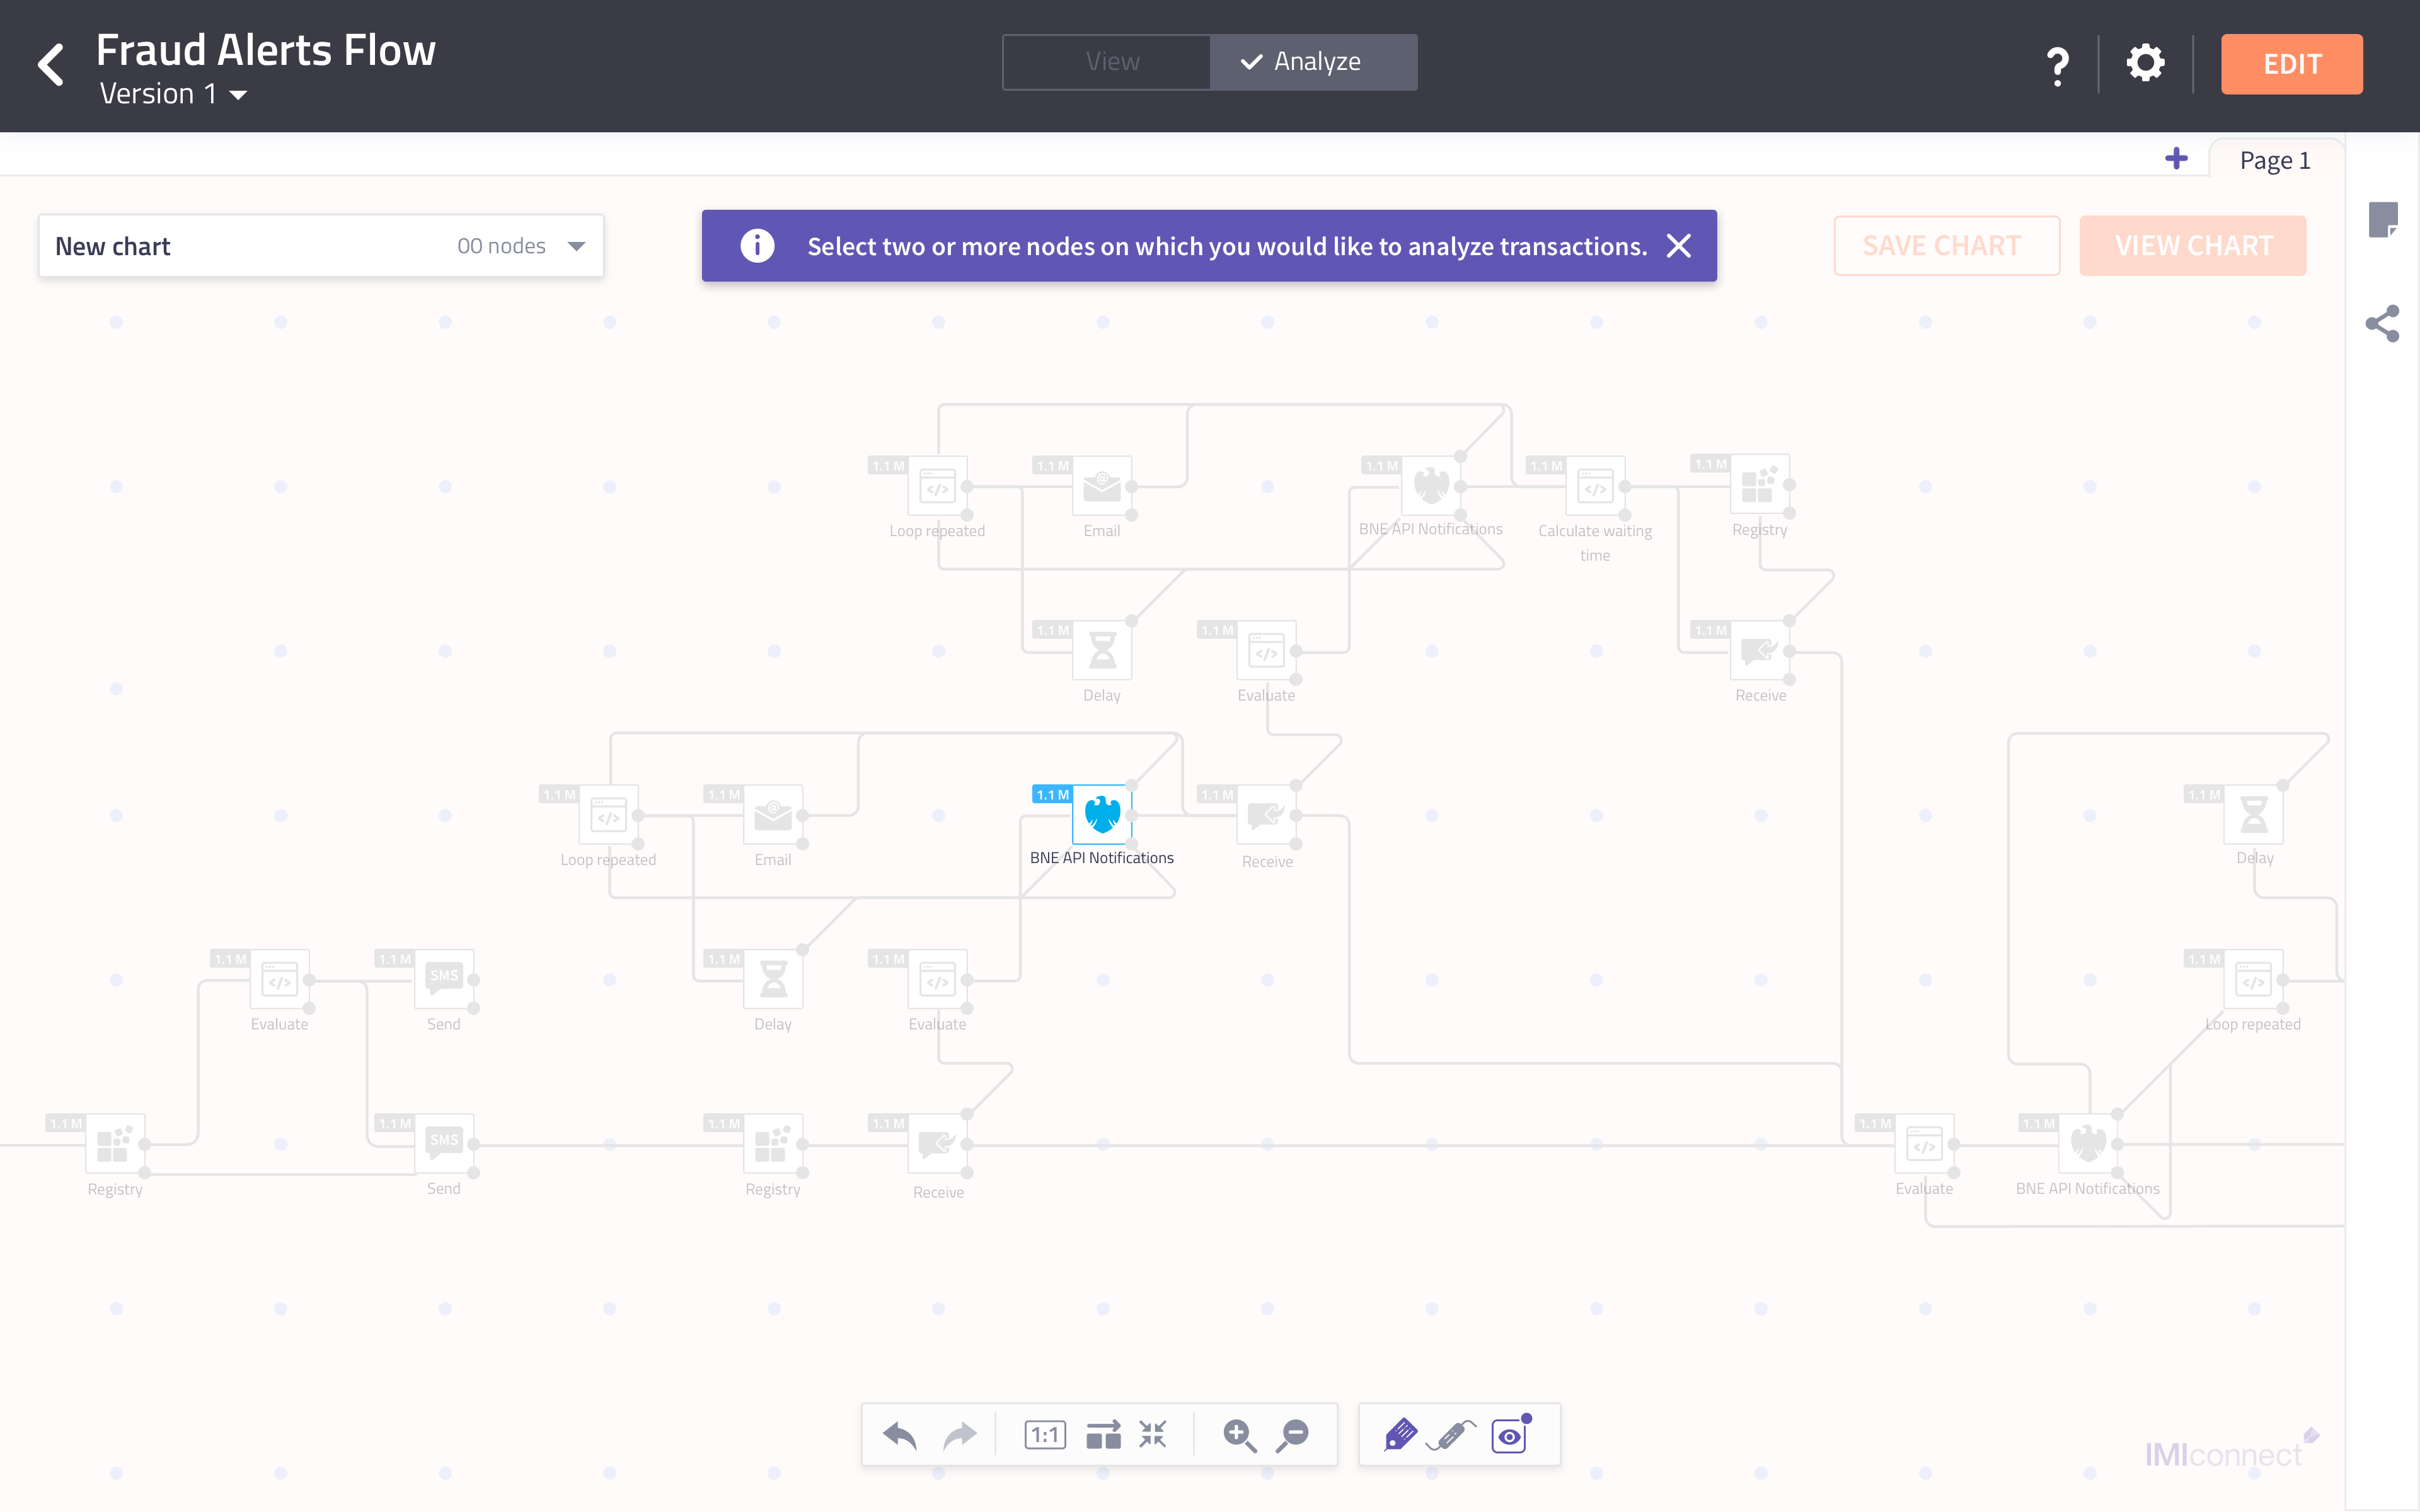
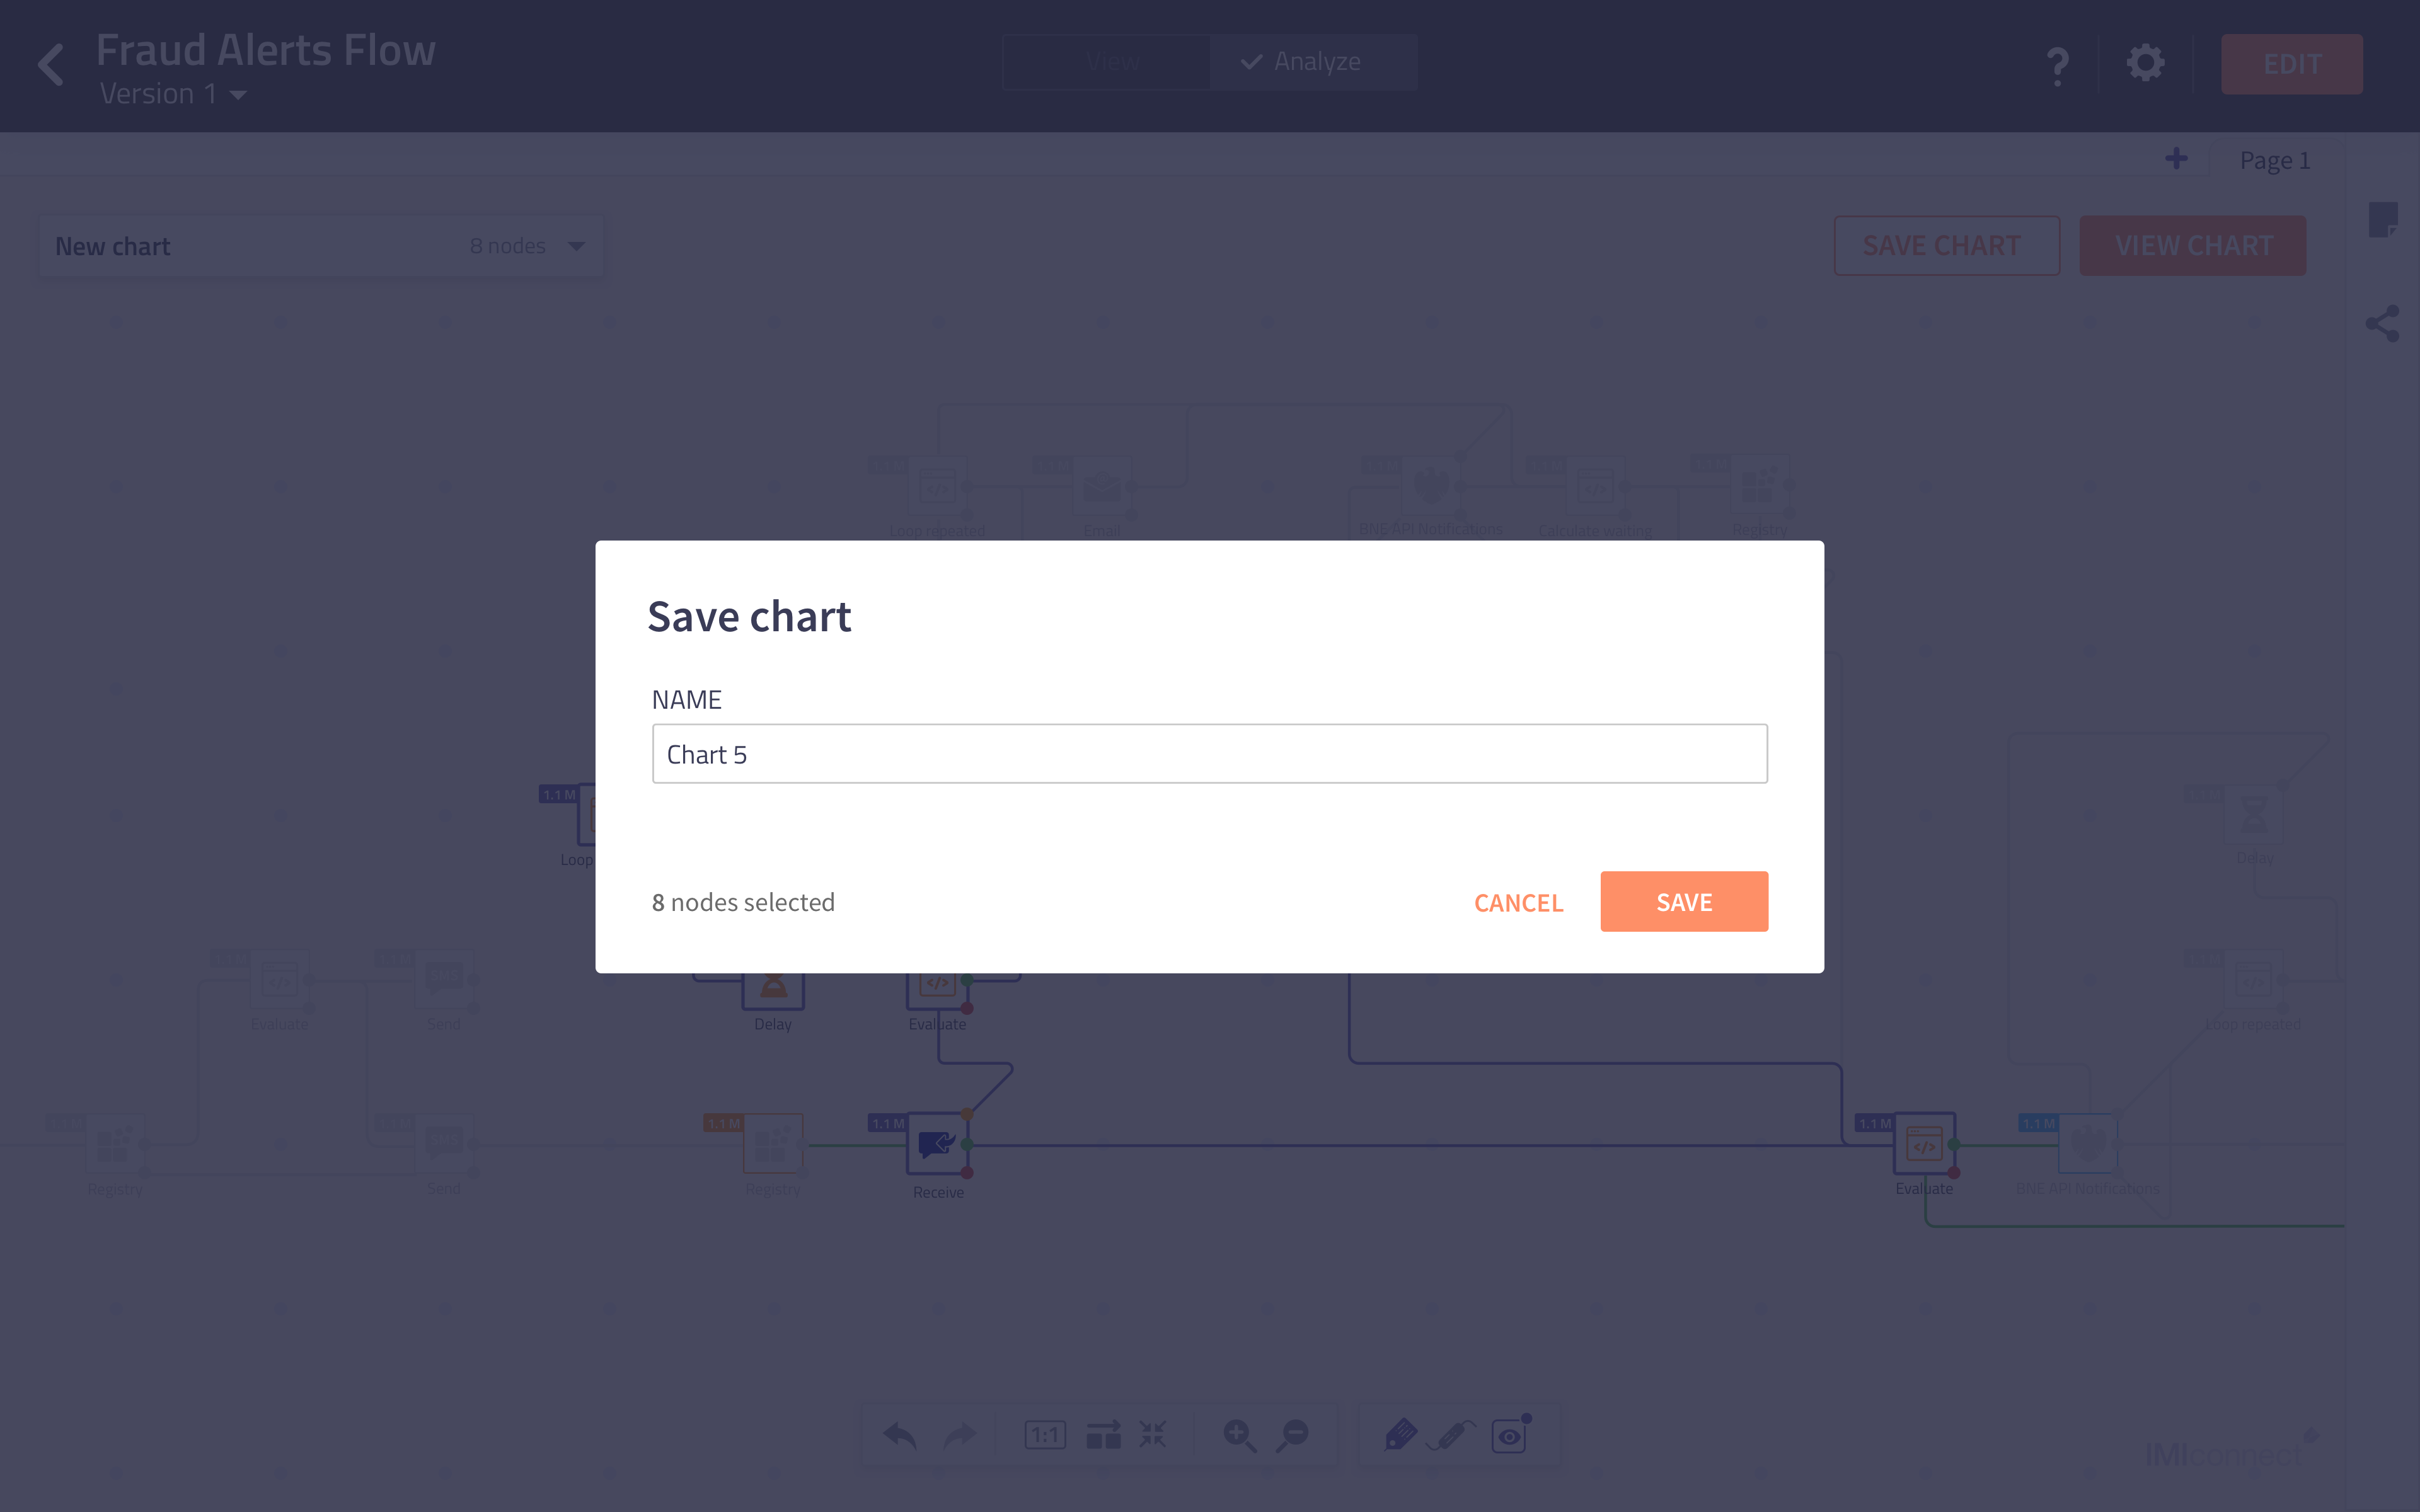
Solution
Enable users to select parts of the flow which are relevant and to analyse them separately. Hence, we provided the option to create multiple segments and save them so that users can refer them in future as well.

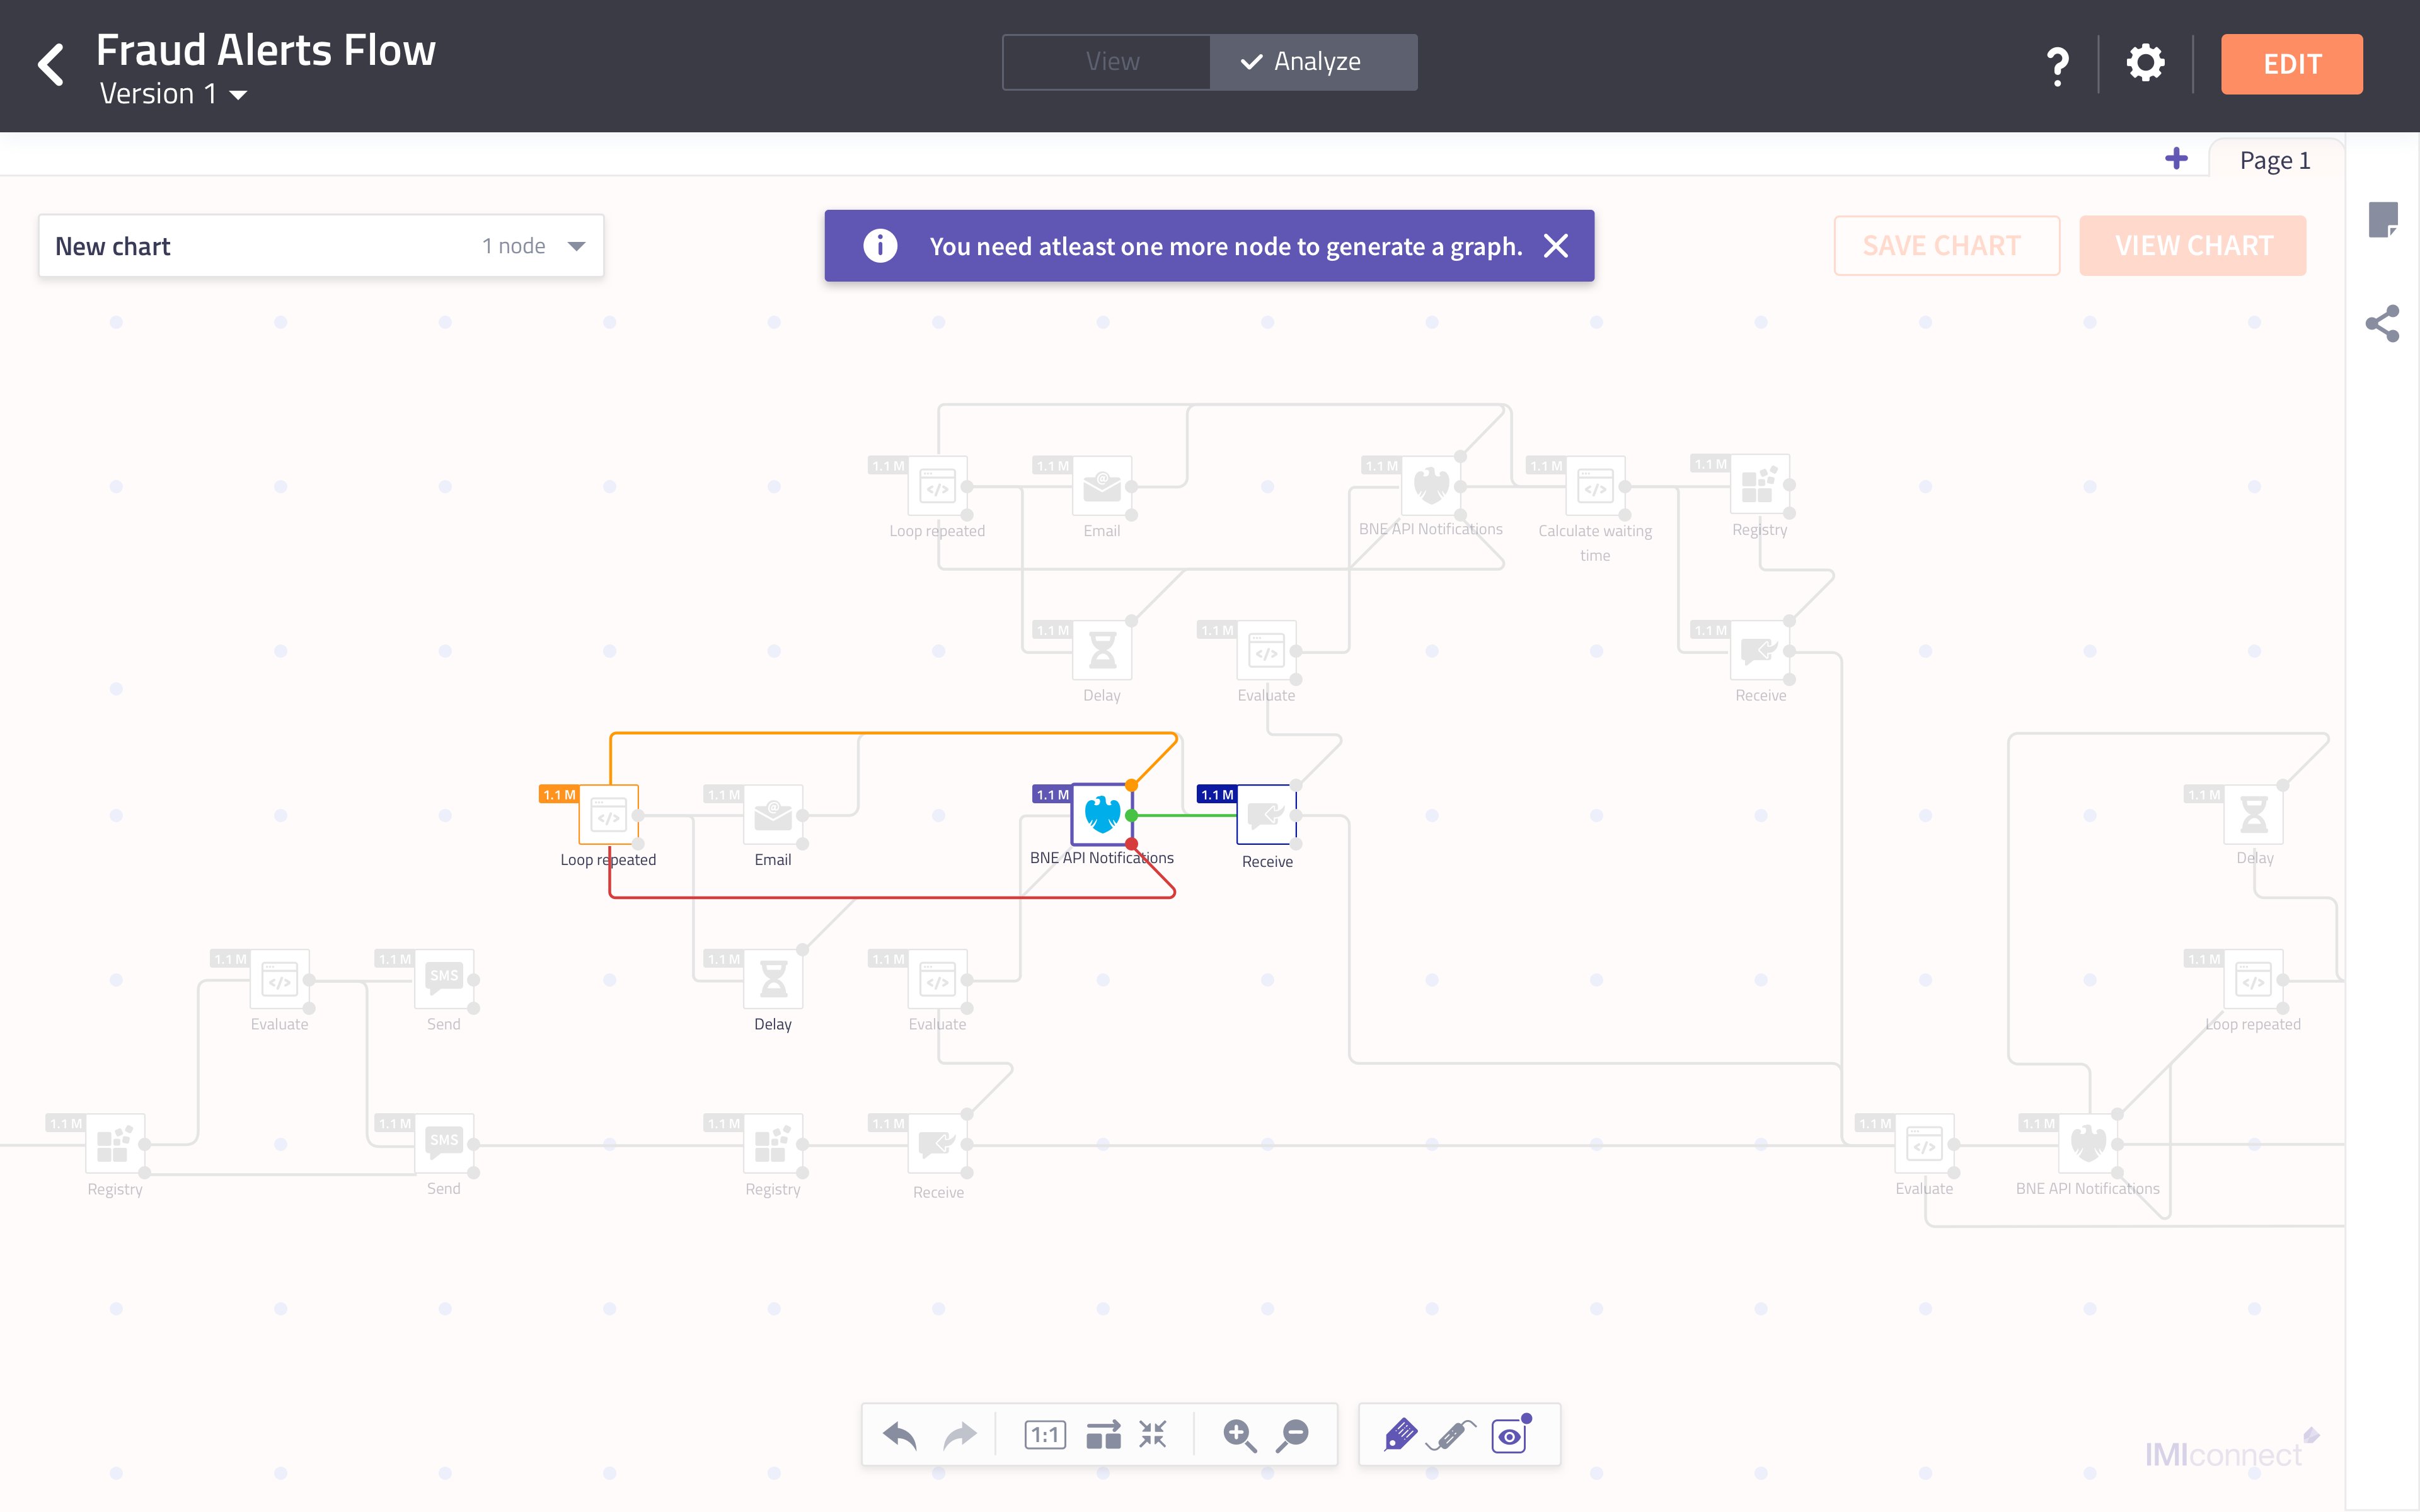
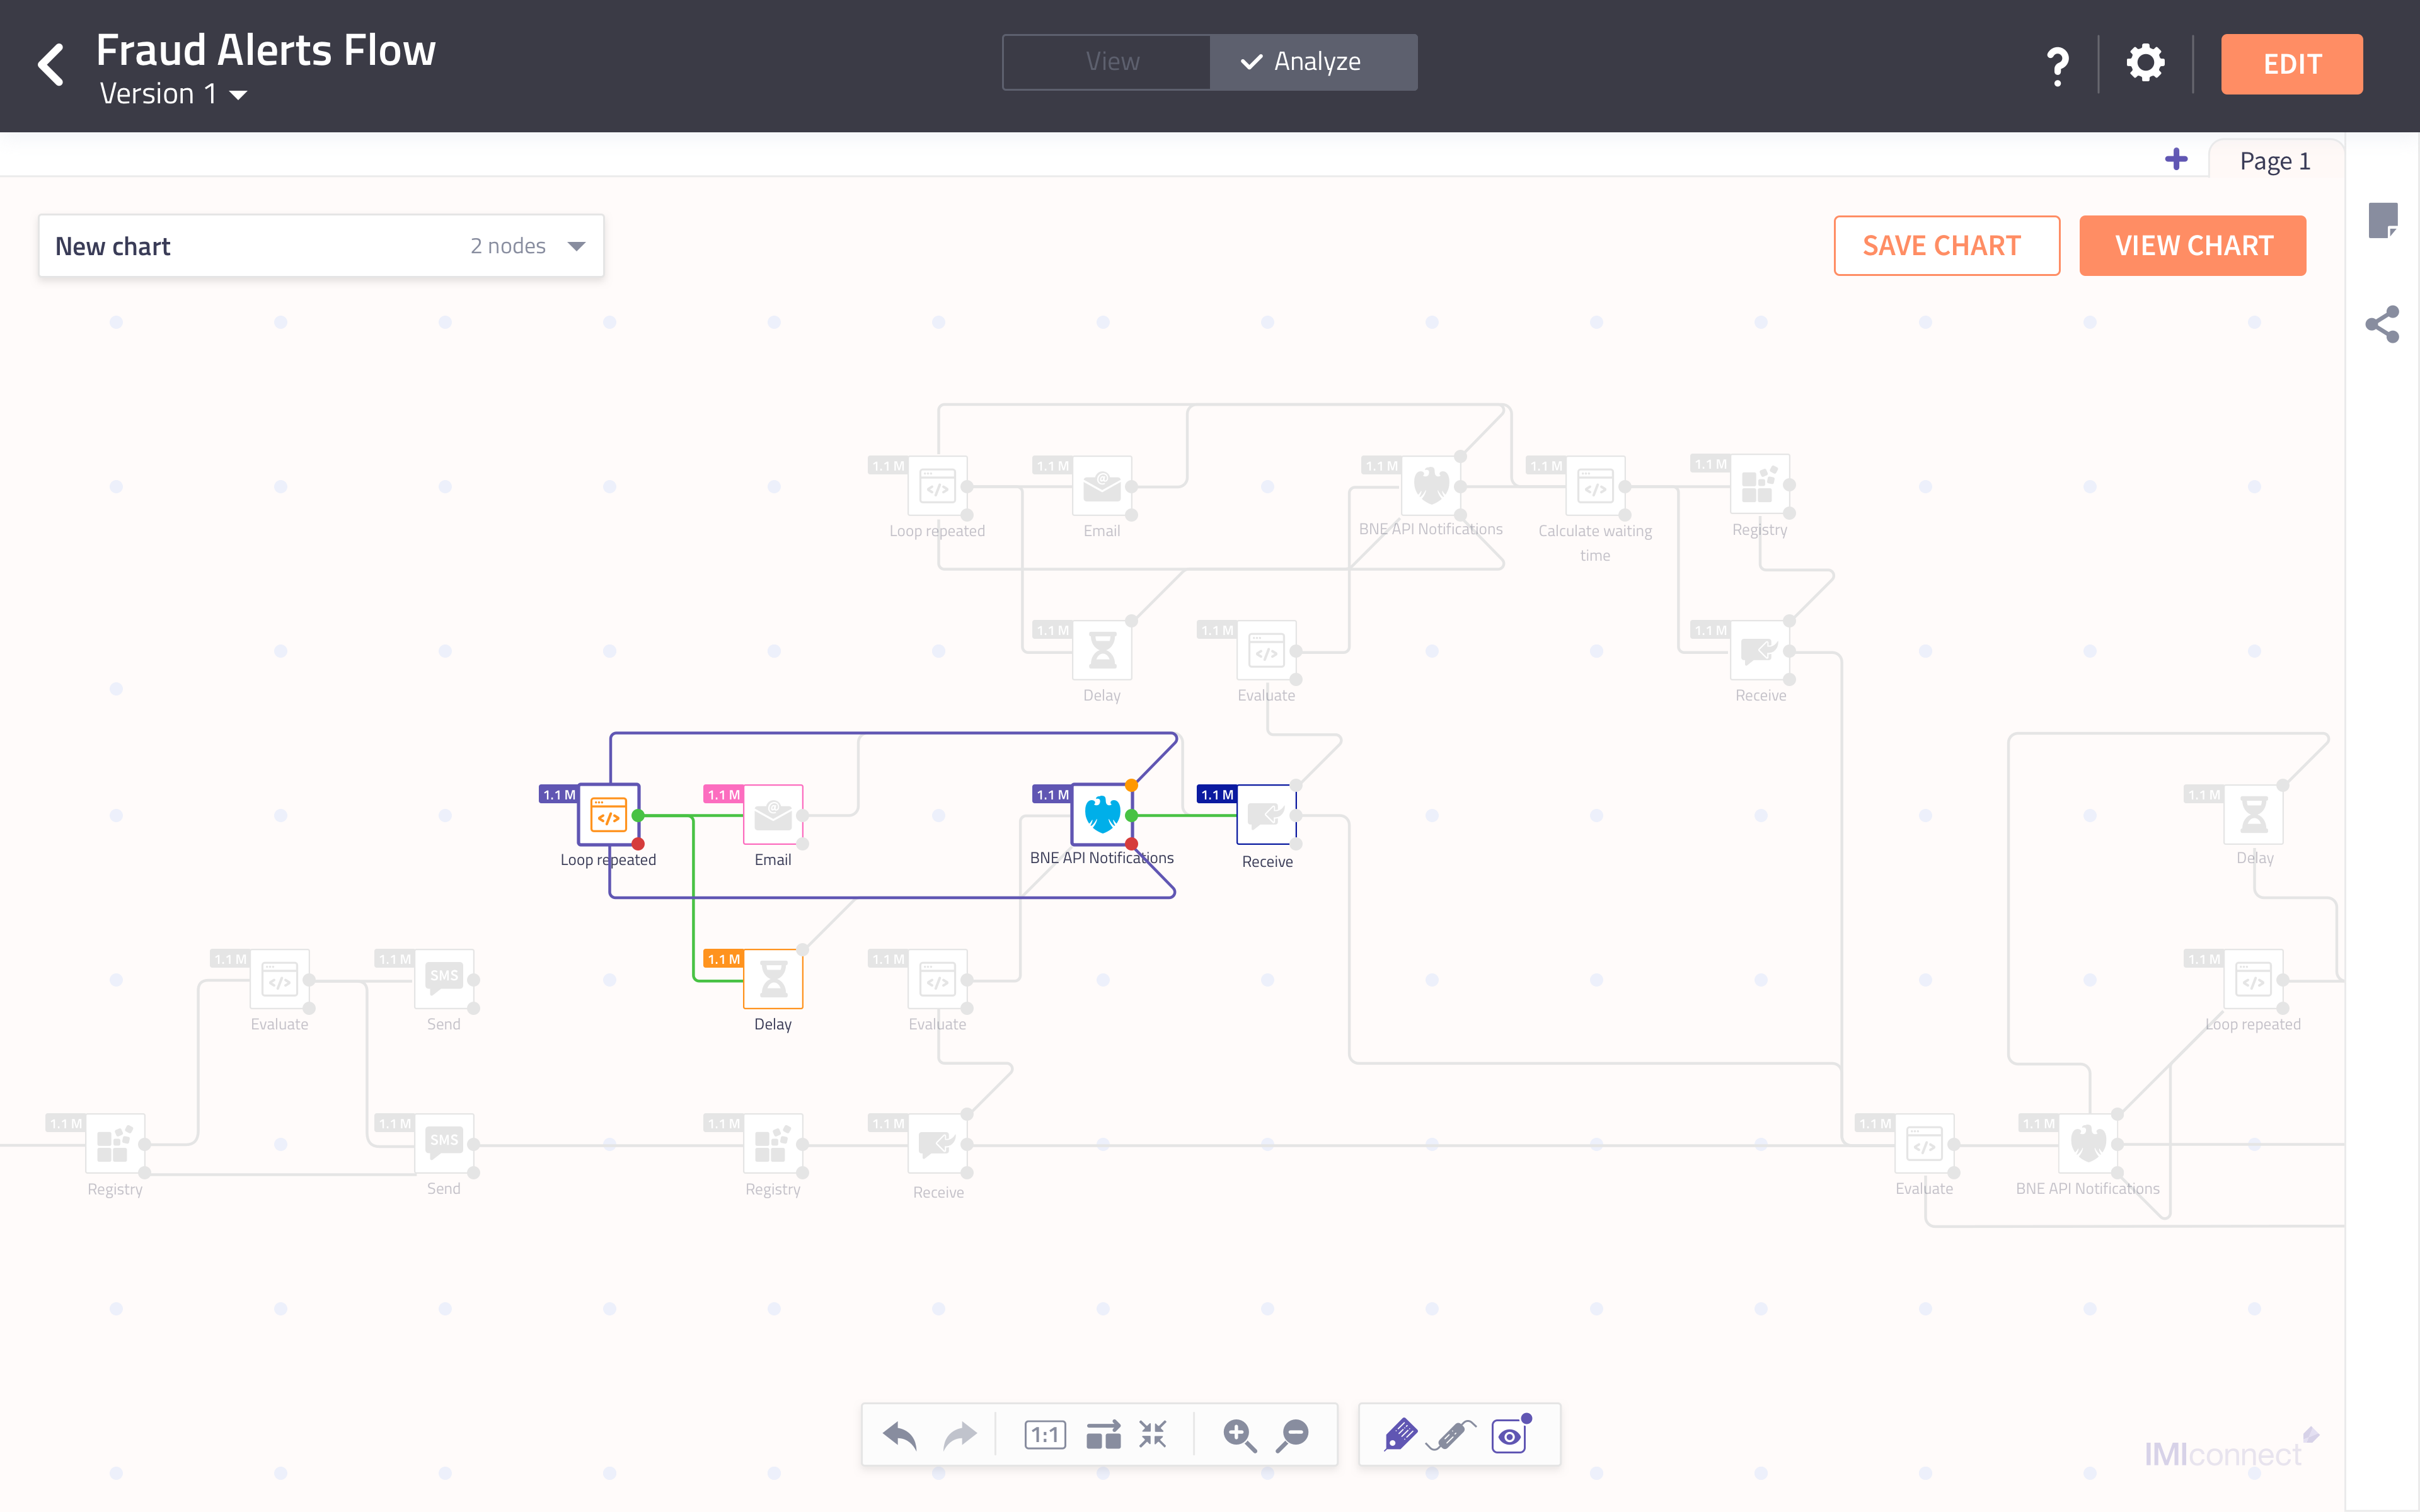
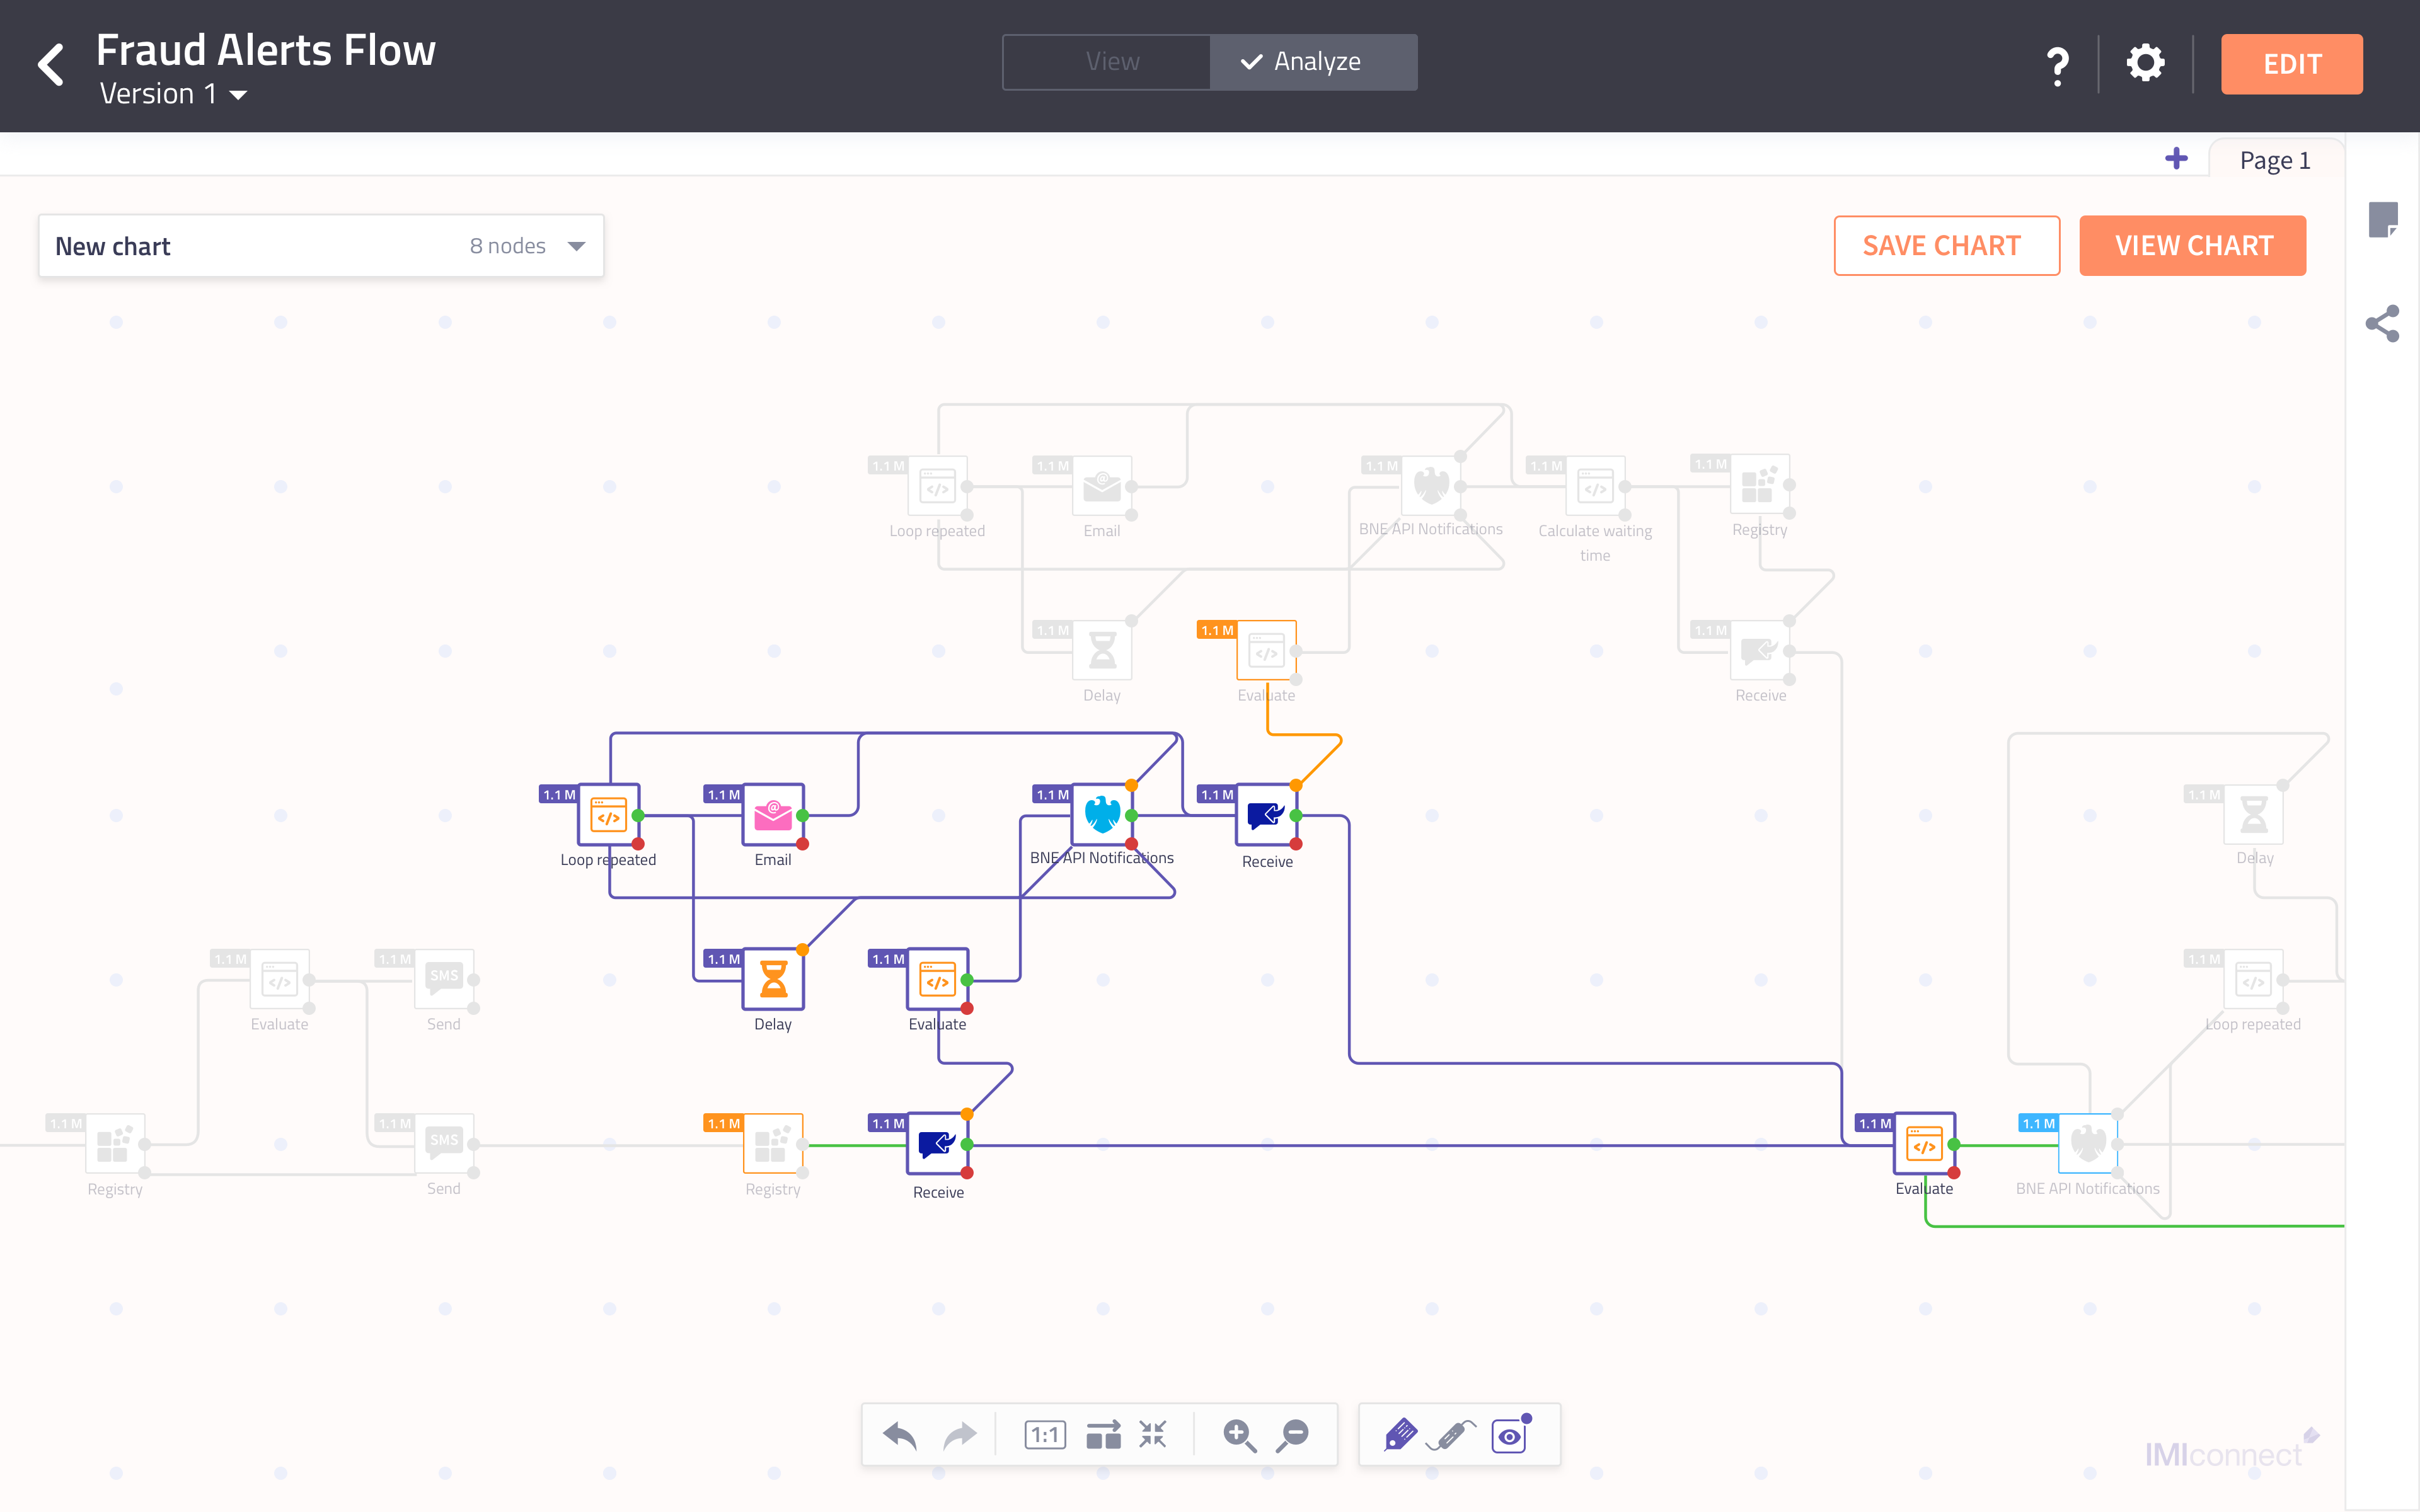
Node selection
User chooses nodes on the flow which are considered important for the respective outcome. On selecting a node, the connectors(both input and output) of the selected node will be highlighted. User can now select any of the adjacent nodes. By following this, user can create a continuous segment in a progressive manner.
Problem statement - 3
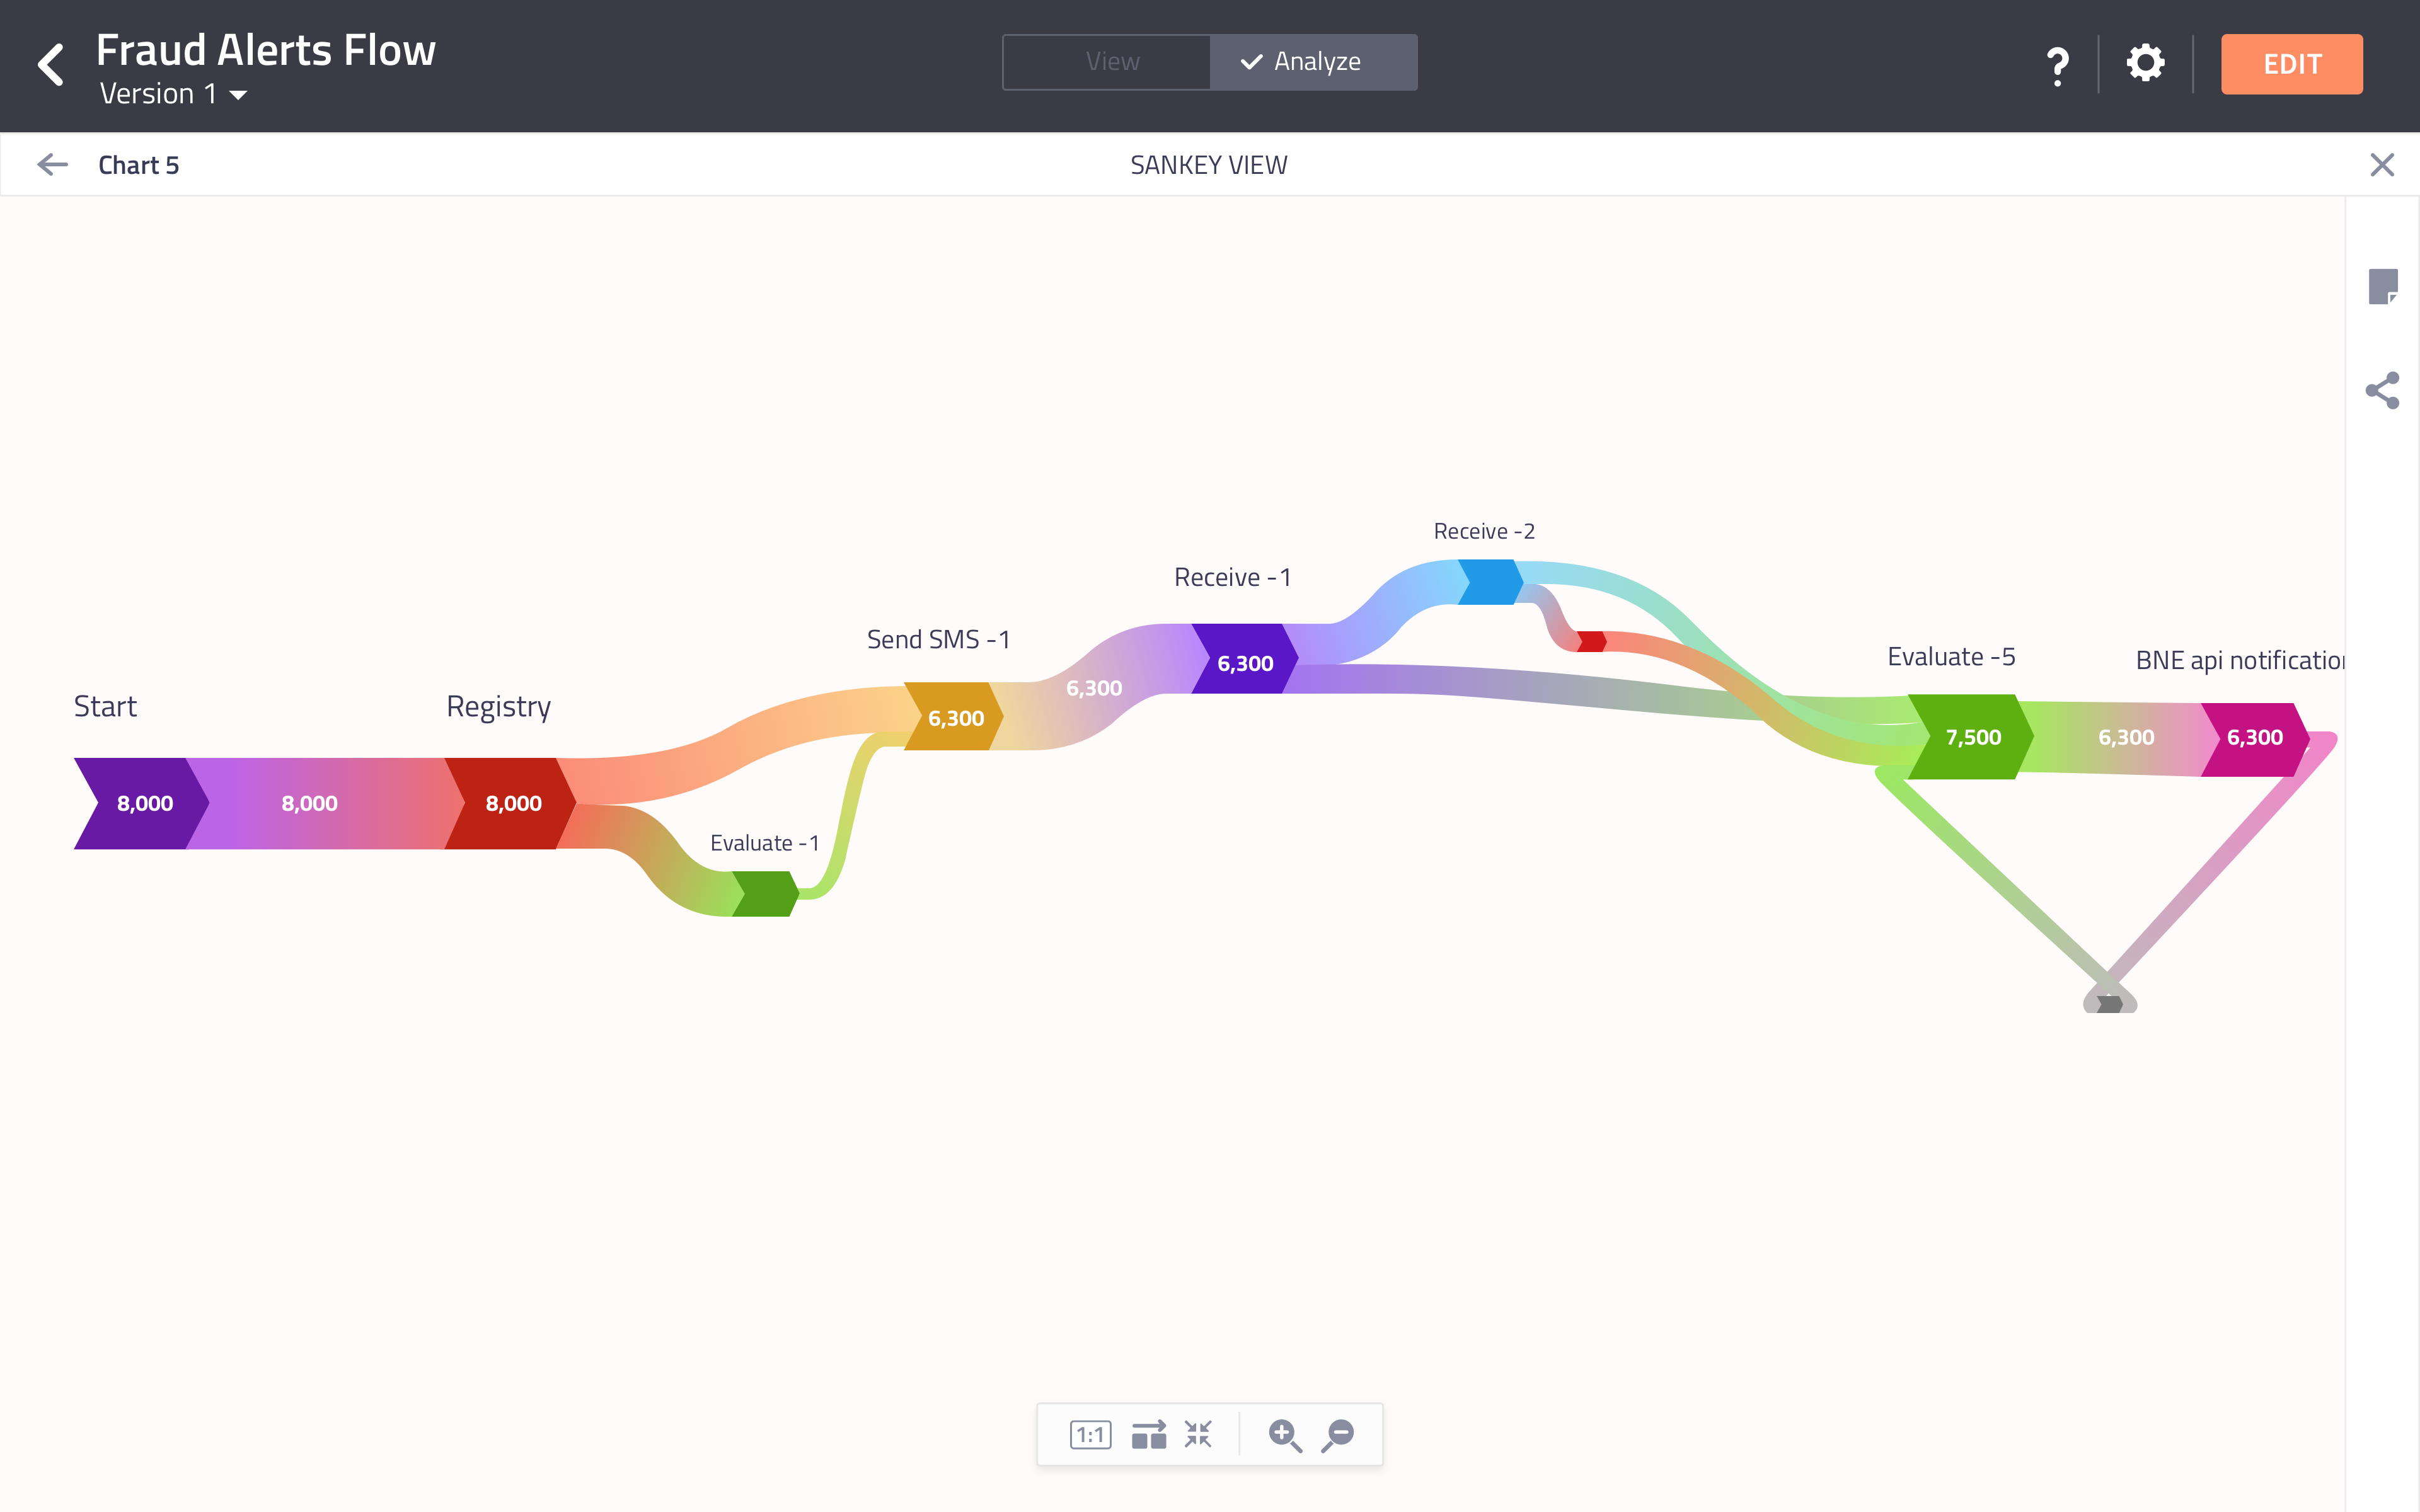
Knowing the transaction counts at a node level is good but can I have a simpler visual representation of the data
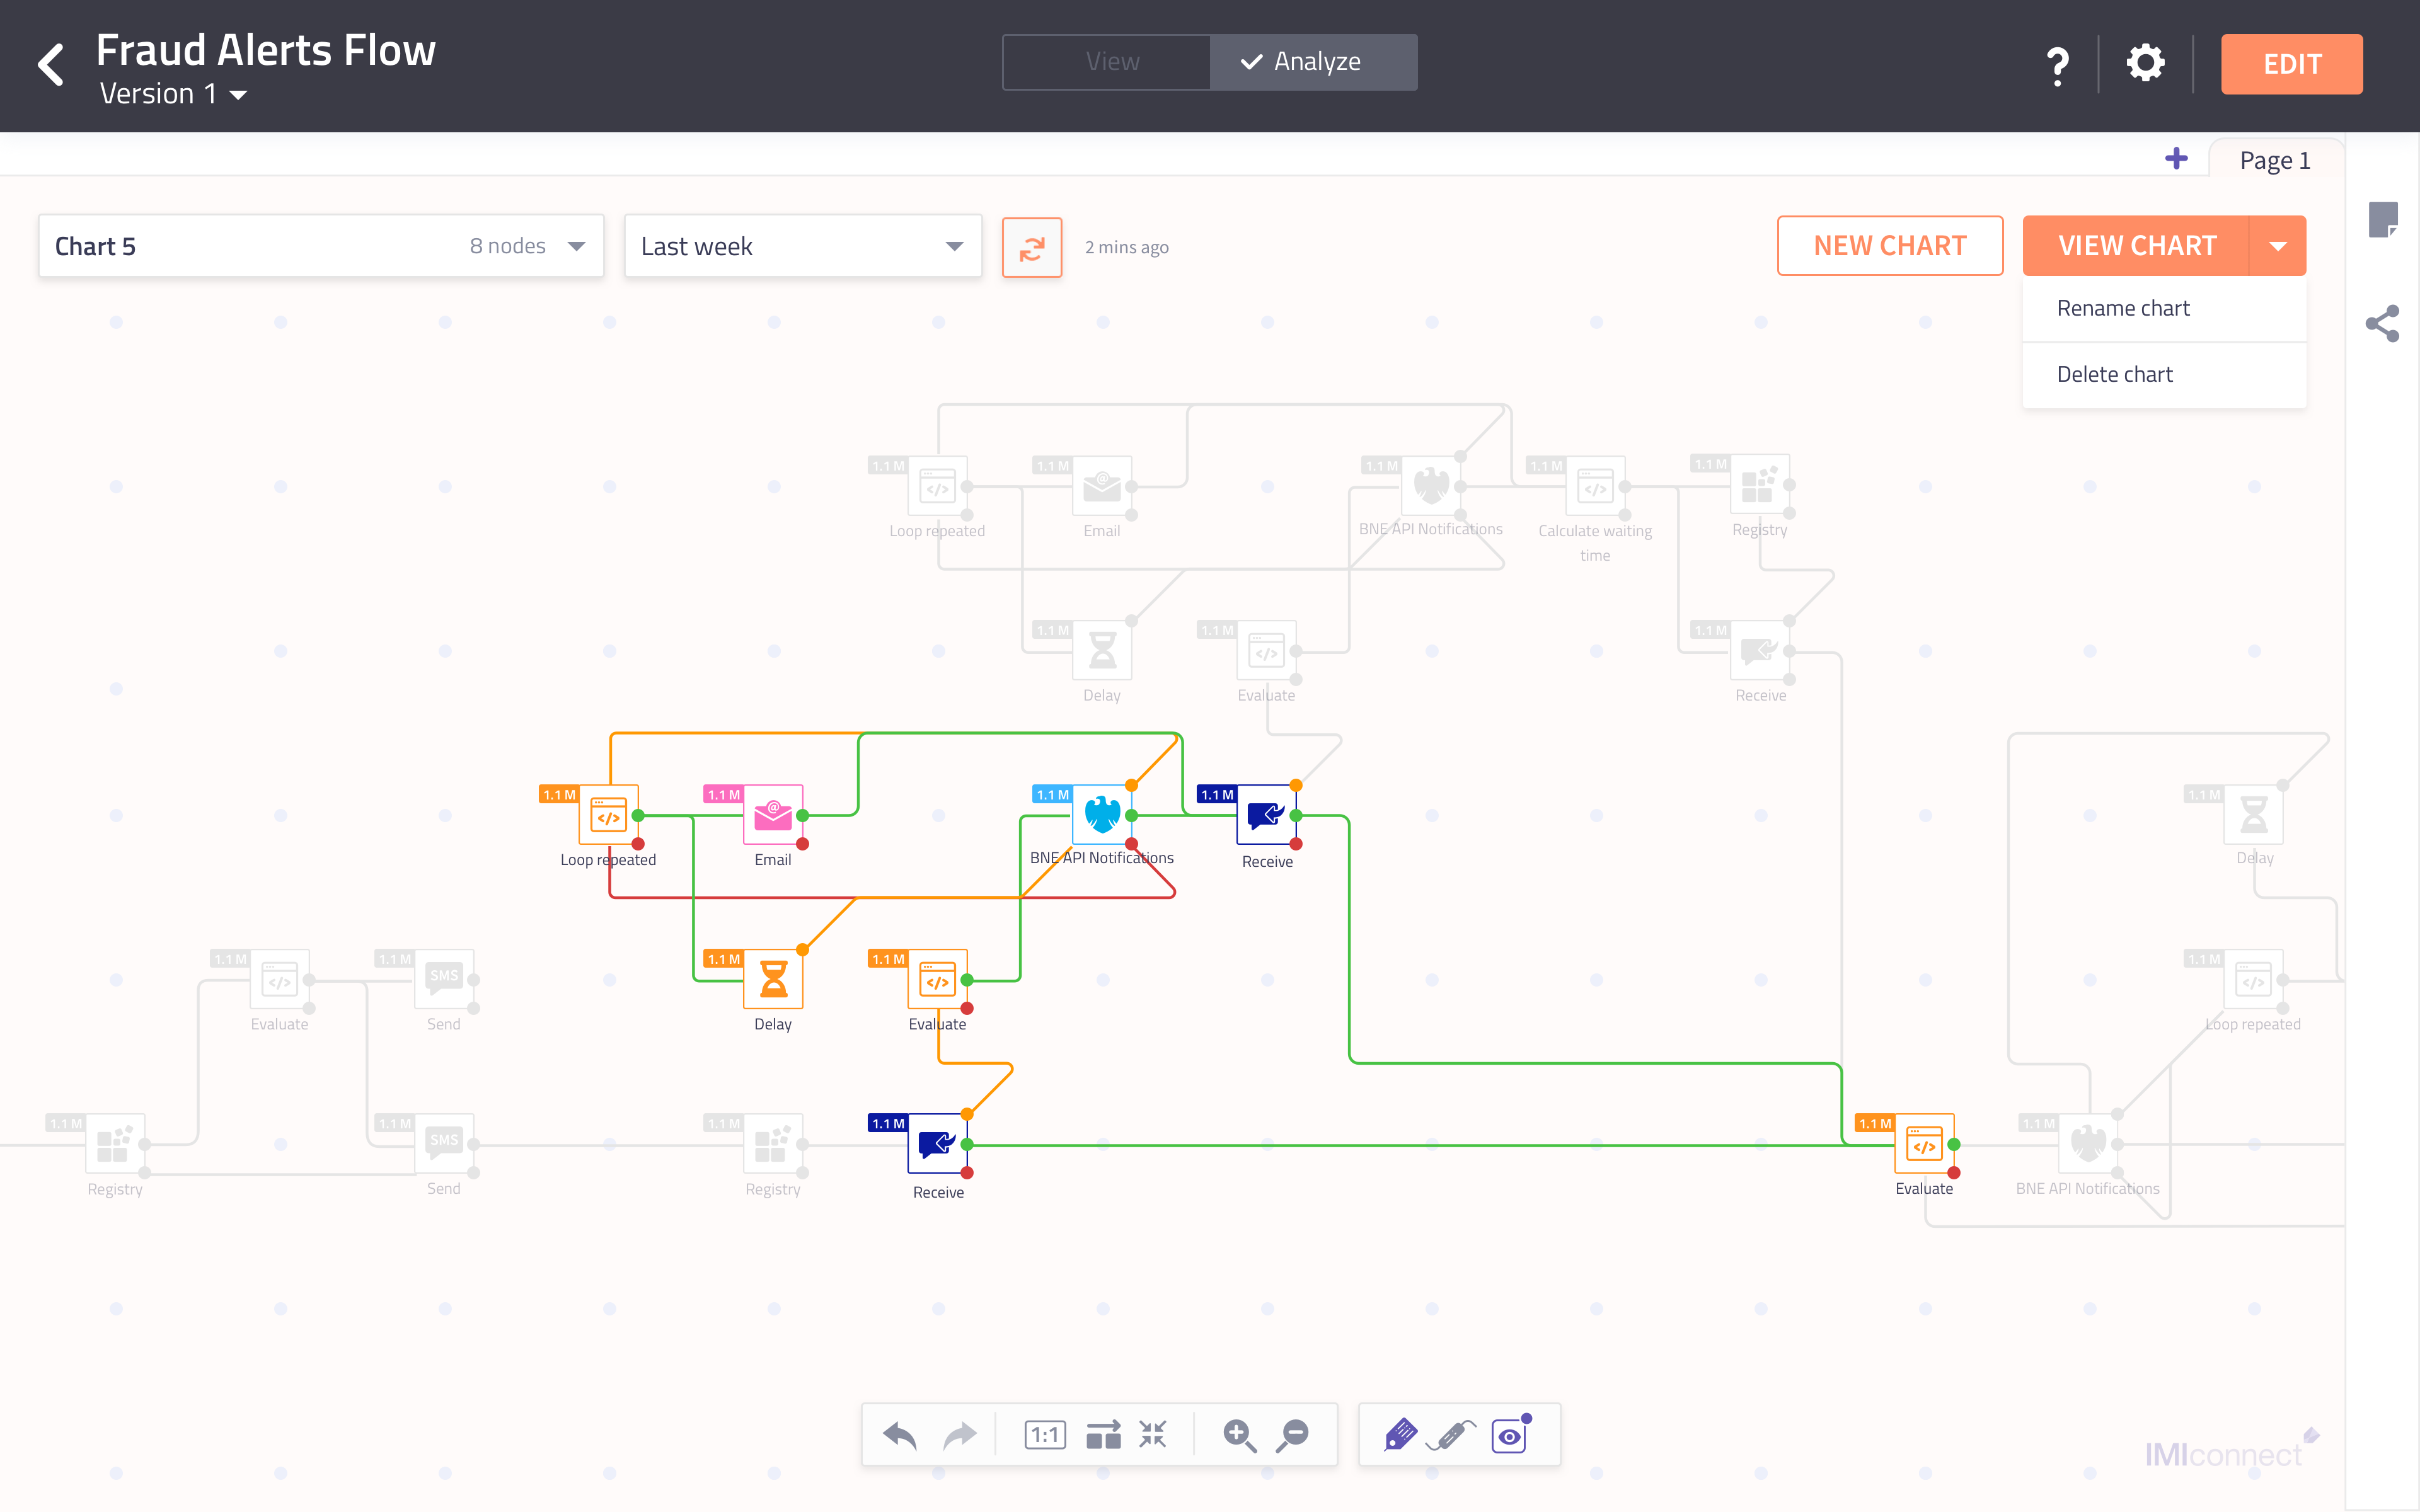
Solution
Provide chart view for the segment user has created.
Problem statement - 4
While I am in analytics mode, I get to see the aggregate counts at every node outcome along with other labels on flow canvas which makes it very cluttered and difficult to see the data.
Solution
A setting where the user can toggle the labels on and off will solve the problem of cluttered canvas in Analyze mode.
Problem statement - 5
While sharing the flow, I don’t want to share the flow performance or transaction counts by default.
Solution
While sharing the flow, the user has the option to choose whether the user wants to share the flow with analytics or without analytics.
Problem statement - 6
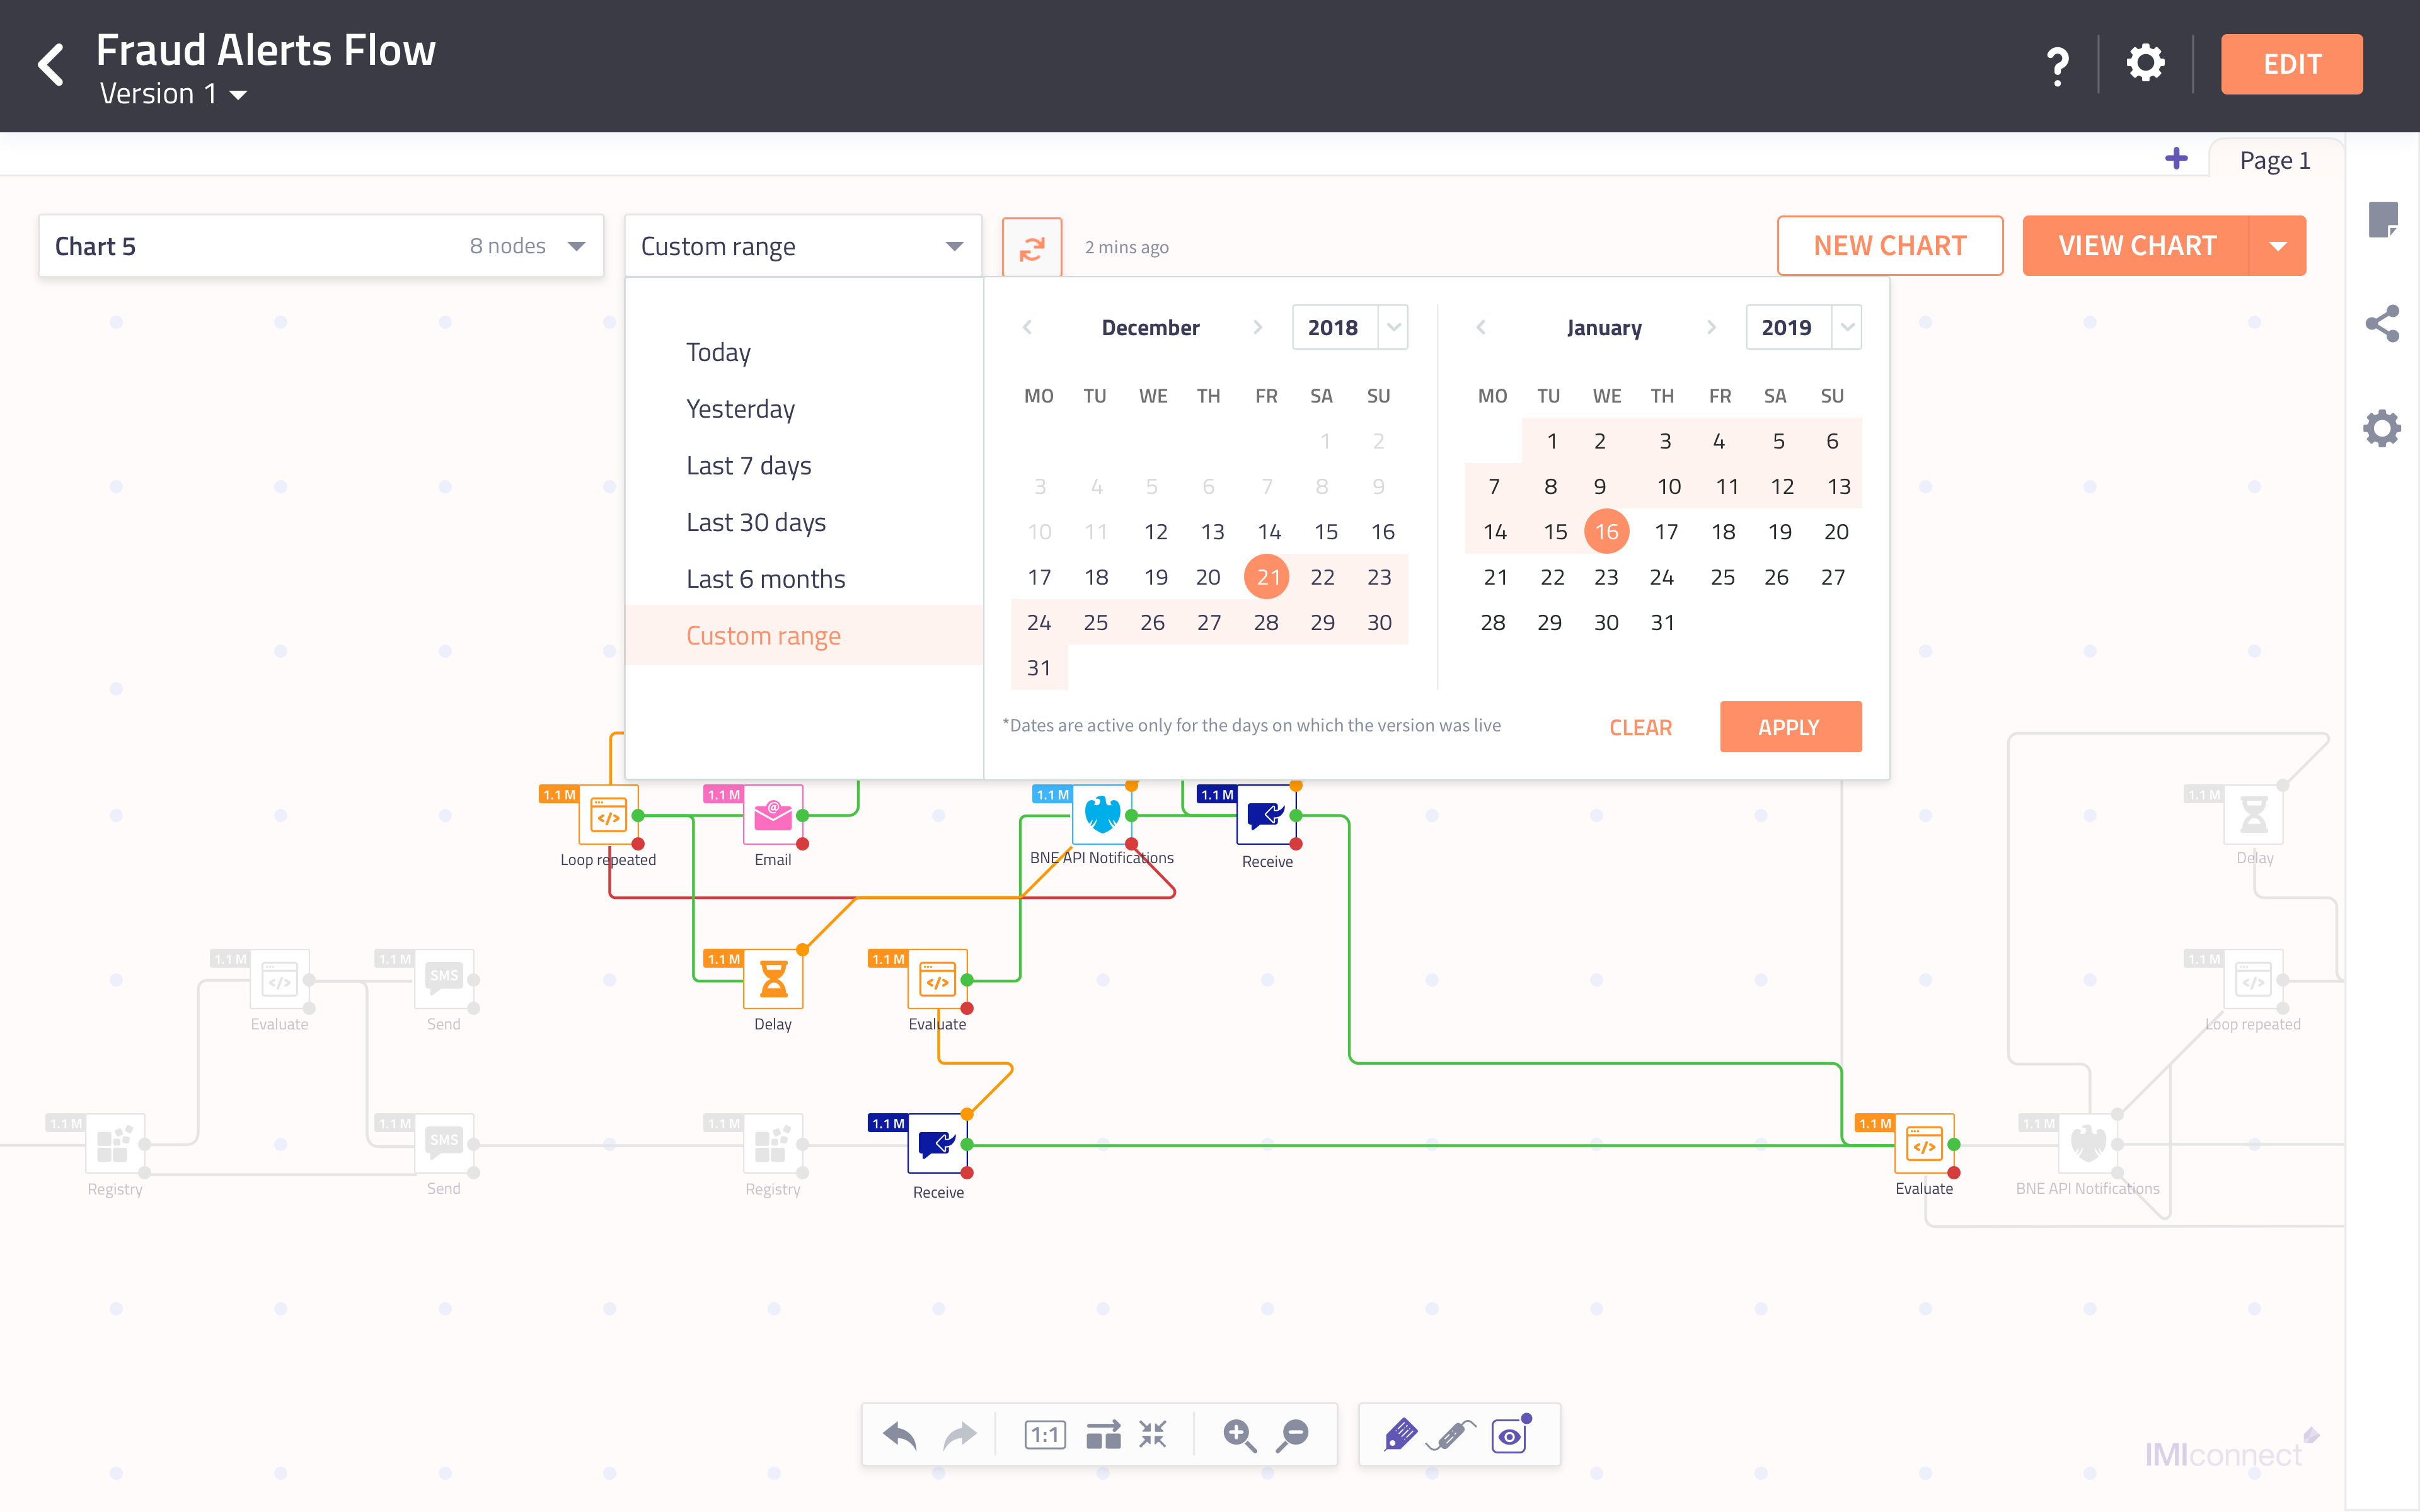
While I am in Analyze mode, I get to see the aggregate counts at every node outcome but if I cannot select a specific time range, I cannot analyse the flow performance at different time periods.
Solution
A time range selector in the analytics mode allows the user to select a specific time range and see the aggregate counts for different time periods as per user need for analysis.

Conclusion
The feature is ready to ship. Worked closely with the product managers and both front-end and back-end developers to craft the best possible experience for the user.